GA4 Basics Blog Series: What Is GA4 & How Does It Work
If you’re like me, you are currently searching for GA4 answers and want them quick. Unfortunately there’s not much
free information out there right now, so I’m starting this GA4 Basics Blog Series to share what I’ve learned. This first article is a tutorial of Google Analytics 4 that covers what it is, how it works and a review of the reports.
What is Google Analytics 4 (GA4)?
Google Analytics 4 is a new analytics tool that took over Universal Analytics (GA3) and officially launched in mid-October 2020. However, most of us didn’t make the switch until we had to - July 1, 2023.
Google’s answer is that GA4 is a cross-platform analytics tool that allows users to track site visitors and monitor key user behavior metrics. GA4 can measure traffic and engagement across websites and apps. It can also provide insights into audience behavior, such as engagement, monetization, and retention.
What’s The Difference between GA3 and GA4? Everything.
Why did Google do this to marketers who have known and loved GA3 for so many years? Privacy concerns.
GA3 VS GA4 Data Comparison
GA3 and GA4 use different data models so they collect data differently. So we can’t really compare the two, because the numbers mean different things.
The GA4 data model is event-based, whereas GA3’s data model was based on sessions. Events measure user interactions that occur on your website or app, such as a form submission, clicking a button, loading a page and more. This means that we started from scratch when we switched from GA3 to GA4 as we could not bring over data from Universal Analytics.
Tips:
- Strongly recommend (if you have not done so already) to download historical GA3 reports before they are forever gone in 2024.
- Create custom event parameters in GA4 to make your data more meaningful.
To give a little more insight here, when we compared GA4 to GA3 data for our clients, we found that Users and Sessions are slightly off - GA4 numbers are slightly higher.
Google Analytics 4 Tutorial
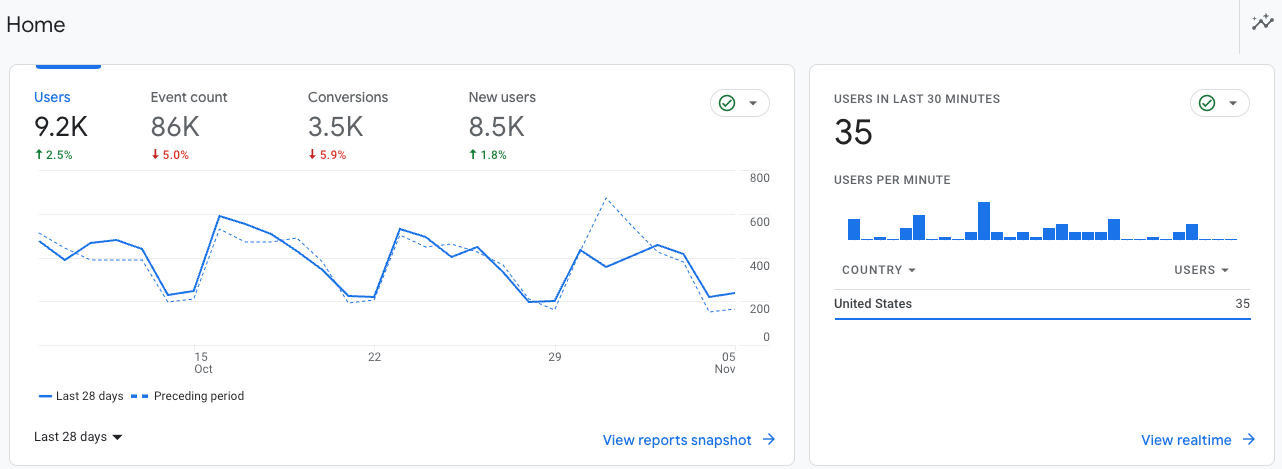
Home
A few of the high-level reports are shown here, though Reports Snapshot is a better section to look at as it has a lot more detailed reports.
Reports include:
- Users, New Users, Event Count and Conversions trending over time (can customize your dates)
- Realtime report on Users in the last 30 minutes
- Recently Accessed Reports Review
- Suggested for You Reports - Examples can include User Locations, Views by Page Title & more
- Some Insights that are automatically generated using Machine Learning & Account Connections
Search Bar: New and improved from Universal Analytics and basically helps you easily find any report in GA4. Another new option is to Ask Questions to be answered by Intelligence.
Analytics Intelligence
is a set of features that uses machine learning and conditions (you configure) to help you understand and act on your data such as custom events. Look to suggestions to see examples.
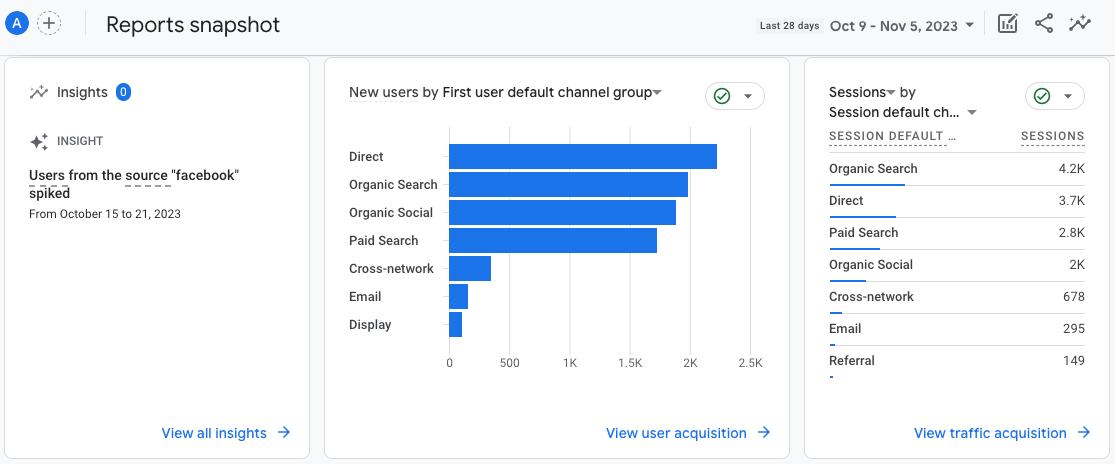
Reports Snapshot:
- Many widgets/cards showing you highlights of all reports in GA4 such as users/engagement overtime, users by channel, sessions by channel, etc.
- Option to customize the cards here which is great. Example: Segment the entire report to a specific audience - so we can just see Google CPC data here.
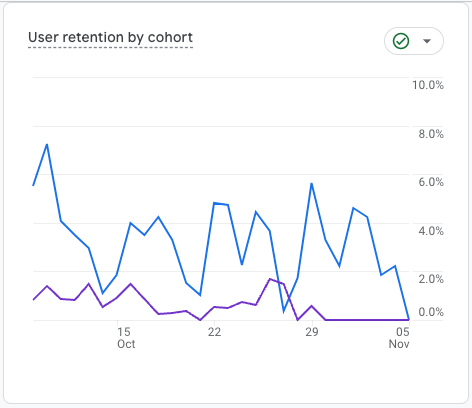
- Some key new reports are: Retention and Traffic by Page Title.
Realtime Report:
New and improved from GA3. Just a lot more reports/data here than there was before like Users by Source, Audience, etc. (We typically only use this report to test if event and conversion tracking is working.)
Life Cycle Reports:
Acquisition:
Helps you identify where your website traffic comes from. Can look to separate reports for specific user data and website session data.
Keep in mind:
- User acquisition:
This only shows the very first traffic source each visitor to the website had. So if a user had their first visit from Social and came the next week from Organic, it only will show as Social since that’s their first touch.
- Traffic acquisition:
Similar situation. Only shows the very first traffic source of each session. If a user has multiple traffic sources within a single session it doesn't show them all (only first one). GA4 solved a UA problem of where new traffic sources (during the same session) would end a current visit and start a new separate visit - GA4 no longer splits sessions but it causes this challenge where it only reports the first traffic source of the entire session. So when doing traffic source reports, the traffic acquisition report will always be missing some traffic sources from sessions with two or more different traffic sources within the same session. View Source
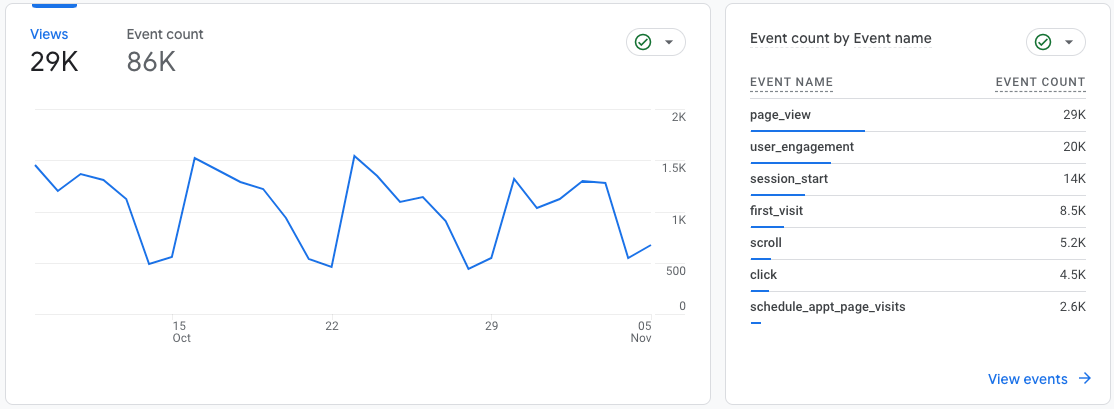
Engagement:
This was the Behavior section in GA3. How much time users are spending on site, events completed, conversions completed, etc. We have new and exciting metrics for engagement in GA4 including average engagement time, engaged sessions per user, average engagement time per session, etc. Have questions for what certain metrics mean? Just hover your mouse over the “?” buttons and GA will tell you the definition.
- Events:
Some are automatically collected, some are custom that you setup via GA or GTM.
- Conversions:
You must mark
important events as conversions in the account for data to show here which is similar to Goals in your GA3 account.
Monetization: New term for Ecommerce Reports. There are lots of report options here with overview, purchases, purchase journey (our favorite), checkout journey, in-app purchases, publisher ads and promotions.
Users:
Demographics:
Overview brings together all of the separate demo reports that you saw in Universal Analytics into one big report.
Detailed Demo Reports:
Table report to focus on any one of the different demographic dimensions.
*Data threshold can be applied here to prevent anyone viewing a report from inferring the identity of individual users based on demographics, interests, or other signals. Data thresholds are system defined. You cannot adjust them.*
Tech:
Similar to the Demo section, all of the separate reports from Universal are in one big report here. Where you can see platform data, devices, etc.
A new and interesting report is Users by Screen Resolution, so you can see the typical size of screens users are using when viewing your website.
Library:
Where to look for unique reports and where you can create custom reports.
Explore:
Used to only be available to Universal Analytics 360 Users - now available to all. Custom reports, templates, and funnels to explore data in more detail. Example is Funnel Exploration: Where you can see a user’s journey to complete a conversion - you just need to update the steps and can save Custom Report Funnel.
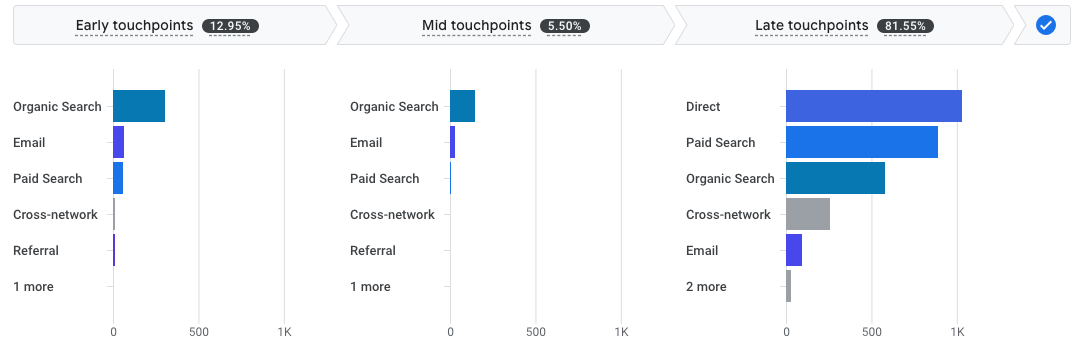
Advertising:
Pulls data from Google Ads campaigns when you connect the accounts. Here you can identify key moments in your customers’ purchase journeys using conversion paths and model comparison reports. Conversion Path Preview Below.
Tip:
Create audiences (replacing segments from GA3) to group users based on defined characteristics, past behaviors or predicted future behavior. You can apply these audiences across GA4 reports and Google Ads. Once enough data is collected you can configure your campaigns to act on GA4 data.
GA4 Helpful Definitions:
- Views vs. Sessions:
A pageview is when a page on your website is visited by a user. A session is a collection of pageviews by a user.
- User Stickiness:
The ratios compare engagement by active users over a narrower time frame with their engagement over a broader time frame. The ratios can help you understand how well you retain users over time — higher ratios suggest good engagement and user retention.
- Engaged Sessions:
The number of sessions that lasted longer than 10 seconds, or had a conversion event, or had 2 or more screen or page views.
- User Engagement:
Shows the time that your app screen or web page was in focus. When your site or app is running but no page or screen is displayed, Analytics doesn't collect the metric.
That’s it for now! Expect a video tutorial of GA4 from us soon. Our next articles will cover how to setup GA4 events and conversions, how to setup and customize GA4 and more. Please contact us at
info@theoryzmedia.com if you have any questions or would like to schedule a full GA4 tutorial with our team.
Stay up-to-date with GA4 Releases Here
Watch Google Analytics 4 Video Tutorials Here